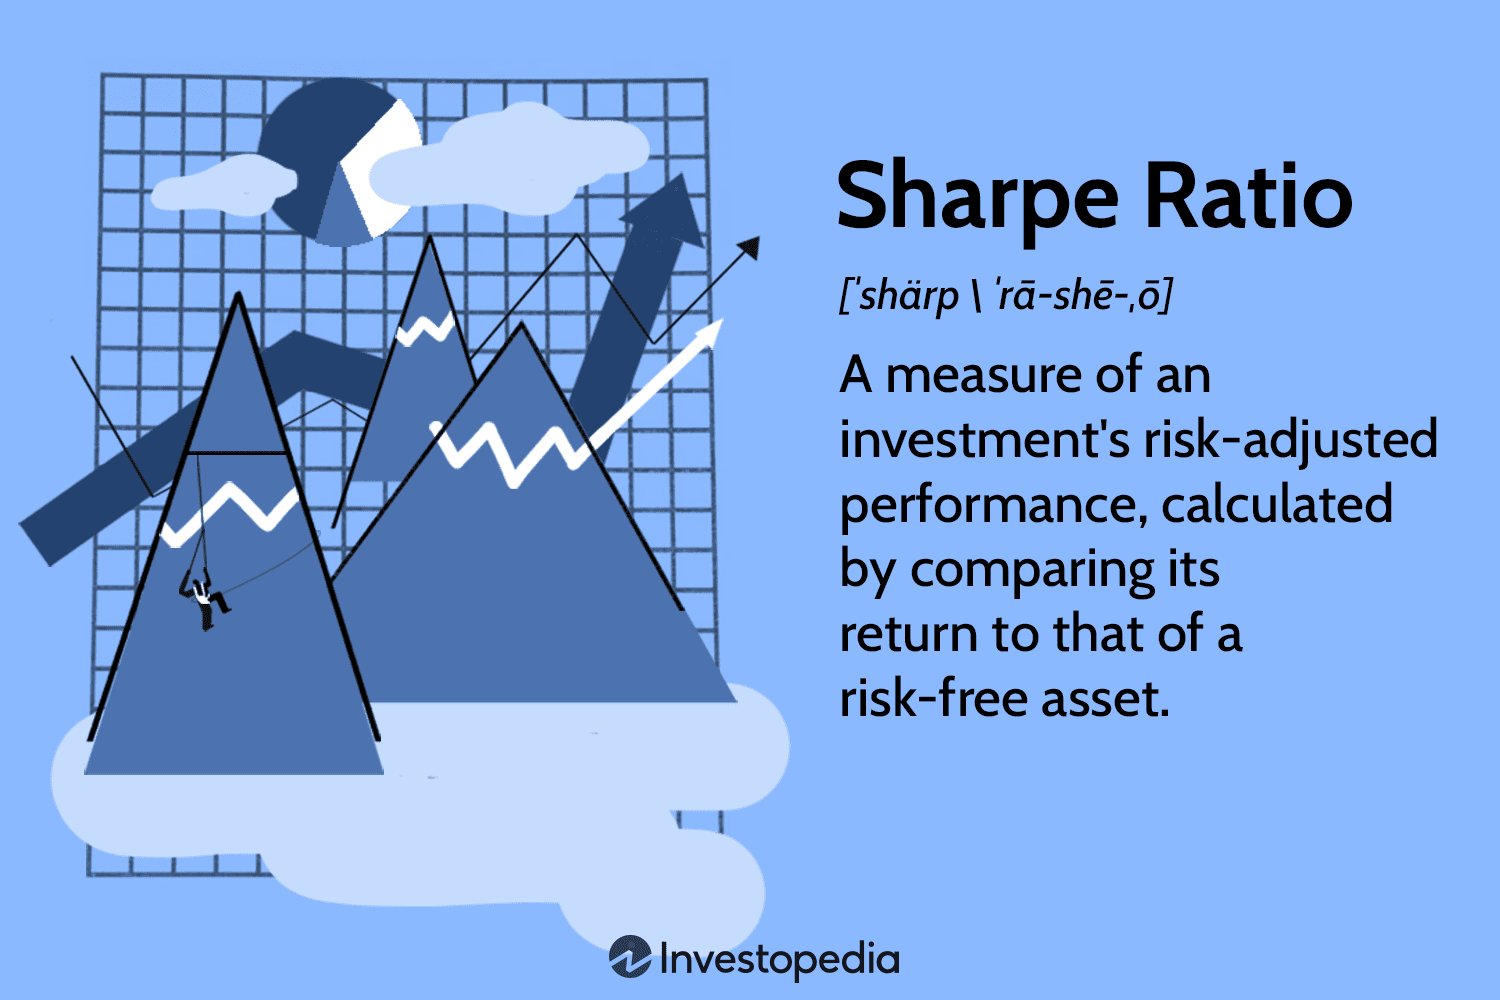
Do you ever find yourself confused when it comes to analyzing investments? If so, you’re not alone. One popular metric that many investors use is the Sharpe ratio. But what exactly is the Sharpe ratio in investment analysis? Well, in short, it’s a measure that helps evaluate the risk-adjusted return of an investment. By taking into account both the return and the volatility of an investment, the Sharpe ratio offers insight into its performance. In this blog article, we’ll delve into the details of the Sharpe ratio, how it’s calculated, and why it’s an important tool for investors. So, let’s dive in and unravel the secrets of the Sharpe ratio!
What is the Sharpe Ratio in Investment Analysis?
Investing in the financial markets can be a daunting task, especially for those who are not familiar with the intricacies of the industry. There are numerous factors to consider, such as risk and return, that can greatly impact investment decisions. One commonly used tool in investment analysis is the Sharpe ratio. The Sharpe ratio is a measure of risk-adjusted performance that helps investors evaluate the attractiveness and potential profitability of investment opportunities. In this article, we will delve into the details of what the Sharpe ratio is and how it is calculated.
Understanding the Sharpe Ratio
The Sharpe ratio, named after its creator William F. Sharpe, is a financial metric that measures the excess return of an investment compared to the risk-free rate of return, adjusted for the standard deviation of the investment’s returns. It provides investors with a way to assess the risk-reward tradeoff of a particular investment or investment portfolio.
The Sharpe ratio takes into account both the return generated by an investment and the level of risk associated with it. It allows investors to compare different investments and determine which one offers the best risk-adjusted return. By incorporating risk, the Sharpe ratio provides a more comprehensive analysis than simply looking at returns alone.
Calculating the Sharpe Ratio
The Sharpe ratio formula is relatively straightforward:
Sharpe Ratio = (Rp – Rf) / σp
Where:
– Rp is the average return of the investment.
– Rf is the risk-free rate of return.
– σp is the standard deviation of the investment’s returns.
Let’s break down each component of the formula:
1. Average Return (Rp): This is the average return generated by the investment over a specific time period. It can be calculated by summing up all the returns and dividing them by the number of periods.
2. Risk-Free Rate of Return (Rf): The risk-free rate is the hypothetical return an investor would earn on a risk-free investment, such as a U.S. Treasury bond. It represents the minimum return an investor expects to receive without taking on any risk.
3. Standard Deviation (σp): The standard deviation is a statistical measure of the dispersion of returns around the average return. It provides insights into the volatility or variability of the investment’s returns. A higher standard deviation indicates greater price volatility and, therefore, higher risk.
By subtracting the risk-free rate from the investment’s average return and dividing it by the standard deviation, the Sharpe ratio quantifies the excess return per unit of risk.
Interpreting the Sharpe Ratio
The Sharpe ratio serves as a valuable tool for investors as it allows them to assess the risk-reward profile of an investment or investment portfolio. Here’s how to interpret the Sharpe ratio:
1. Positive Sharpe Ratio: A positive Sharpe ratio indicates that the investment or portfolio has generated excess returns above the risk-free rate for each unit of risk taken. The higher the Sharpe ratio, the better the risk-adjusted performance.
2. Negative Sharpe Ratio: A negative Sharpe ratio suggests that the investment or portfolio has underperformed the risk-free rate, considering the level of risk taken. This indicates poor risk-adjusted performance.
3. Sharpe Ratio of 0: A Sharpe ratio of 0 implies that the investment or portfolio has generated returns equal to the risk-free rate, with no excess return per unit of risk. It indicates a neutral risk-reward tradeoff.
Benefits and Limitations of the Sharpe Ratio
The Sharpe ratio offers several benefits in investment analysis:
1. Risk-adjusted Comparison: The Sharpe ratio enables investors to compare different investments or portfolios on a risk-adjusted basis. This allows for a more meaningful evaluation of investment opportunities.
2. Objective Measure: By incorporating both return and risk, the Sharpe ratio provides an objective measure of an investment’s performance. It helps investors make informed decisions based on a comprehensive analysis.
3. Portfolio Optimization: Investors can use the Sharpe ratio to optimize their investment portfolios by allocating their funds to investments with higher risk-adjusted returns.
However, it is important to be aware of the limitations of the Sharpe ratio:
1. Reliance on Historical Data: The Sharpe ratio relies on historical data to calculate returns and standard deviation. Past performance may not accurately predict future performance, making the ratio subject to potential inaccuracies.
2. Risk Assumption: The Sharpe ratio assumes that the investment’s returns follow a normal distribution, which might not always be the case. In reality, financial markets can exhibit extreme or non-normal behaviors.
3. Single-Factor Analysis: The Sharpe ratio is a single-factor analysis and does not take into account other factors that may influence an investment’s performance, such as market trends or company fundamentals.
In conclusion, the Sharpe ratio is a valuable tool in investment analysis that allows investors to assess the risk-reward profile of an investment or investment portfolio. By considering both returns and risk, the Sharpe ratio provides a more comprehensive perspective than evaluating returns alone. It aids in comparing investments on a risk-adjusted basis and helps investors make informed decisions. However, it is essential to understand the limitations of the Sharpe ratio and use it in conjunction with other analysis techniques to gain a more complete understanding of investment opportunities.
Sharpe Ratio
Frequently Asked Questions
Frequently Asked Questions (FAQs)
What is the Sharpe ratio in investment analysis?
The Sharpe ratio is a measure used in investment analysis to assess the risk-adjusted return of an investment. It helps investors understand whether the returns they are receiving are worth the level of risk they are taking. Calculated by dividing the excess return of an investment over the risk-free rate by its standard deviation, the Sharpe ratio provides a quantitative way to evaluate investment performance.
How is the Sharpe ratio calculated?
To calculate the Sharpe ratio, you need the annualized excess return of the investment (the investment return minus the risk-free rate) and the standard deviation of the investment returns. The formula is as follows: Sharpe Ratio = (Average Return of Investment – Risk-Free Rate) / Standard Deviation of Investment.
What does a higher Sharpe ratio indicate?
A higher Sharpe ratio implies a better risk-adjusted return. It indicates that an investment generates higher returns relative to the amount of risk taken. Investors often prefer investments with higher Sharpe ratios as they offer more favorable risk-return trade-offs.
How should the Sharpe ratio be interpreted?
The Sharpe ratio should be interpreted as a measure of risk-adjusted return. A value of 1 or higher is considered good, while a negative value implies the investment underperforms the risk-free rate. However, it is important to compare the Sharpe ratios of different investments within the same context and industry for accurate assessment.
What are the limitations of the Sharpe ratio?
The Sharpe ratio has certain limitations. It assumes that investment returns follow a normal distribution, which may not be the case in reality. Additionally, it relies on historical data and past performance, which may not be indicative of future results. Furthermore, the Sharpe ratio does not consider non-financial risks or qualitative factors that can affect investment decisions.
Can the Sharpe ratio be negative?
Yes, the Sharpe ratio can be negative. A negative Sharpe ratio indicates that the investment’s returns are not sufficient to compensate for the risk taken. It suggests the investment has performed worse than the risk-free rate or has a higher level of risk compared to the expected returns.
What is the risk-free rate used in the Sharpe ratio calculation?
The risk-free rate used in the Sharpe ratio calculation is typically the rate of return on a risk-free investment, such as a government bond or a Treasury bill. It represents the return that could be obtained without taking on any investment risk.
Can the Sharpe ratio be used to compare different types of investments?
Yes, the Sharpe ratio can be used to compare different types of investments, as long as the risk-free rate and the investment returns are calculated consistently. However, it is important to consider the nature of the investments being compared and any specific factors that may impact their risk and return characteristics.
Is the Sharpe ratio the only measure of investment performance?
No, the Sharpe ratio is not the only measure of investment performance. There are other indicators, such as the Sortino ratio, Treynor ratio, and Jensen’s alpha, which also provide insights into risk-adjusted returns. Each measure has its own strengths and limitations, and investors often consider multiple metrics to evaluate investment performance comprehensively.
Final Thoughts
The Sharpe ratio is a widely used tool in investment analysis that helps investors evaluate the risk-adjusted performance of a particular investment or portfolio. By measuring the excess return of an investment per unit of risk, the Sharpe ratio provides valuable insights into both the return potential and the volatility associated with an investment. A higher Sharpe ratio indicates better risk-adjusted returns, while a lower ratio suggests higher volatility relative to returns. Understanding the Sharpe ratio can assist investors in making informed decisions by quantifying the risk-reward tradeoff. Incorporating this ratio into investment analysis can enhance portfolio management strategies and improve overall investment performance.


