Looking to understand technical indicators and how they can help you in stock trading? You’re in the right place! Technical indicators play a crucial role in analyzing and predicting the movement of stock prices. By utilizing these tools, traders gain valuable insights into market trends, price patterns, and potential entry or exit points. In this article, we will dive deep into the world of understanding technical indicators in stock trading, exploring their significance and how they can enhance your trading strategies. So, let’s get started!
Understanding Technical Indicators in Stock Trading
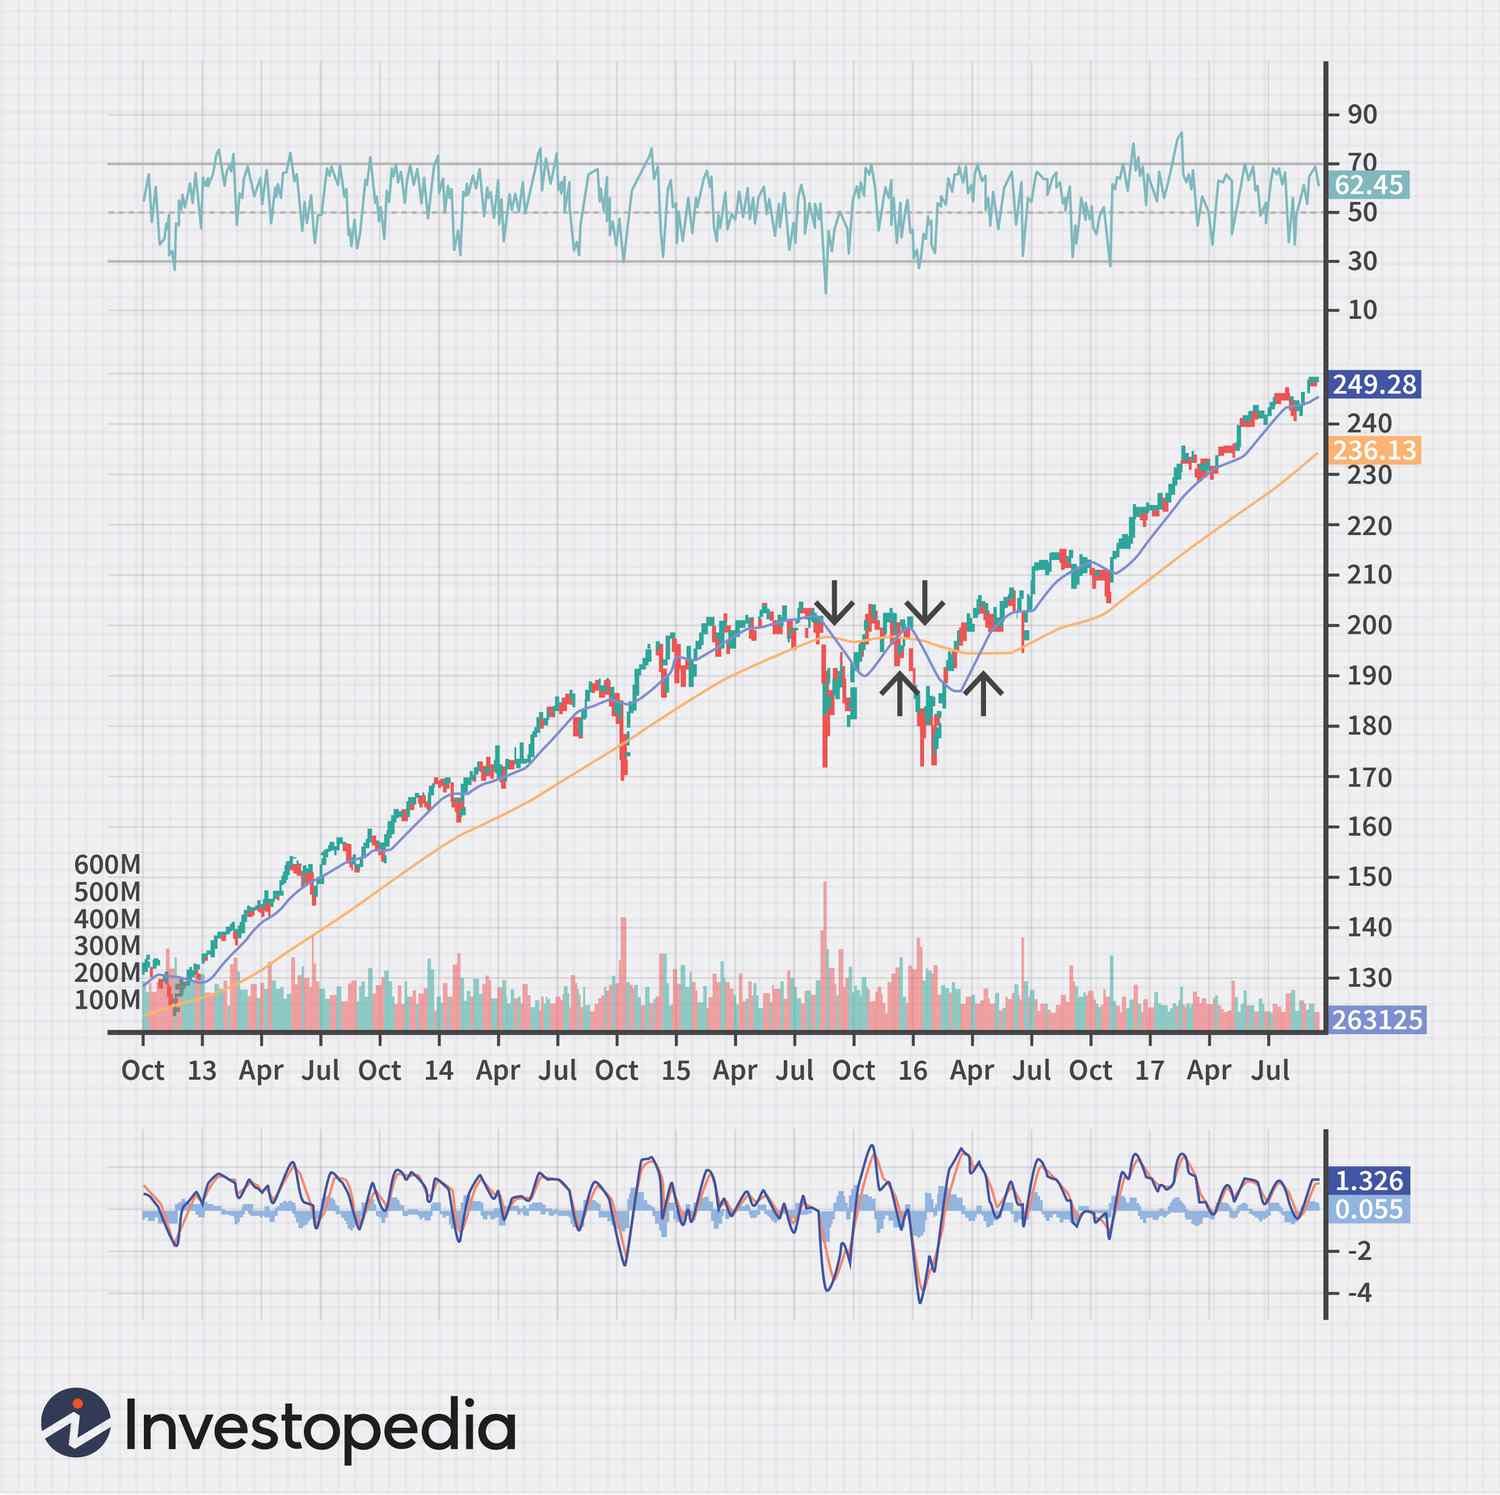
When it comes to stock trading, understanding and analyzing the market is crucial for making informed investment decisions. Technical analysis plays a vital role in this process, and one of the key tools used by traders is technical indicators. Technical indicators are mathematical calculations applied to stock price and volume data, providing insights into market trends, momentum, and potential reversals. In this article, we will delve into the world of technical indicators, exploring their types, interpretations, and how they can be utilized to enhance your trading strategies.
What Are Technical Indicators?
Technical indicators are graphical or numerical tools used to analyze the historical price and volume data of a stock or any other financial instrument. They assist traders in understanding and predicting market movements, identifying trends, overbought or oversold conditions, and potential entry or exit points for trades. These indicators are derived from various mathematical formulas and calculations, combining price and volume data to generate valuable insights.
Types of Technical Indicators
There are numerous technical indicators available, each designed to serve a specific purpose in analyzing the market. These indicators can be broadly categorized into the following types:
Trend Indicators
Trend indicators help traders identify the overall direction of a stock’s price movement. These indicators are particularly useful in trending markets, where the price is consistently moving in one direction. Some commonly used trend indicators include:
- Moving Averages (MA): Moving averages smooth out price data, providing a clear visual representation of the trend. They are calculated by averaging the closing prices of a specified number of periods.
- Exponential Moving Averages (EMA): Similar to moving averages, EMAs assign greater weight to recent price data. This makes EMAs more responsive to recent price changes.
- Ichimoku Cloud: This indicator incorporates multiple lines and a shaded area to provide a comprehensive view of the trend, support, and resistance levels.
- Parabolic SAR: The Parabolic SAR helps identify potential trend reversals. It places dots above or below the price, indicating the direction of the trend.
Momentum Indicators
Momentum indicators assist traders in identifying the speed or strength of a price movement. They help determine whether a stock is overbought or oversold and potential reversal points. Some popular momentum indicators include:
- Relative Strength Index (RSI): The RSI measures the magnitude of recent price changes, indicating whether a stock is overbought or oversold. It ranges from 0 to 100, with values above 70 considered overbought and values below 30 considered oversold.
- Stochastic Oscillator: The stochastic oscillator compares a stock’s closing price to its price range over a specified period. It provides insights into overbought and oversold conditions.
- MACD (Moving Average Convergence Divergence): MACD calculates the difference between two moving averages, revealing potential changes in momentum. It consists of a MACD line, signal line, and a histogram.
- ADX (Average Directional Index): ADX measures the strength of a current trend. It ranges from 0 to 100, with values above 25 indicating a strong trend.
Volatility Indicators
Volatility indicators help traders gauge the magnitude of price fluctuations. They are particularly useful for identifying potential breakouts or reversals. Some common volatility indicators include:
- Bollinger Bands: Bollinger Bands consist of a moving average and two standard deviation lines. They visually represent the volatility of a stock and potential price extremes.
- ATR (Average True Range): ATR measures the average range between high and low prices over a specified period. It provides insights into a stock’s volatility levels.
- Donchian Channels: Donchian Channels plot the highest high and lowest low over a specified period. They help identify potential breakouts or trend reversals.
Interpreting Technical Indicators
While technical indicators provide valuable insights, it’s important to understand their interpretations and limitations. Here are a few key points to consider when interpreting technical indicators:
- No single indicator guarantees accurate predictions. It’s crucial to use multiple indicators and combine them with other forms of analysis for a comprehensive assessment.
- Indicators should be utilized in conjunction with market fundamentals and other tools to validate signals.
- Technical indicators are not foolproof and can provide false signals. Traders must consider the market context and apply discretion in their decision-making process.
- Understanding the strengths and weaknesses of each indicator is essential for effective interpretation.
Utilizing Technical Indicators in Trading Strategies
Technical indicators can be incorporated into various trading strategies to improve decision-making and enhance profitability. Here are a few ways traders utilize technical indicators:
Trend Following
Traders employ trend-following strategies by identifying stocks with strong trends and entering trades in the direction of the trend. Moving averages, Parabolic SAR, and Ichimoku Cloud are commonly used to identify trends and potential entry or exit points.
Momentum Trading
Momentum traders focus on stocks with strong upward or downward momentum, aiming to capitalize on short-term price movements. RSI, Stochastic Oscillator, and MACD are popular indicators used in momentum trading strategies.
Reversal Trading
Reversal traders seek to identify potential trend reversals and profit from price corrections. Indicators such as RSI, MACD, and Bollinger Bands can assist in identifying overbought or oversold conditions and potential reversal points.
Breakout Trading
Breakout traders aim to profit from significant price movements that occur after a stock breaks through a predefined support or resistance level. Bollinger Bands, Donchian Channels, and ATR are commonly used to identify potential breakouts.
In the world of stock trading, technical indicators play a crucial role in analyzing market trends and making informed decisions. By understanding the different types of technical indicators, their interpretations, and how to incorporate them into trading strategies, traders can gain a competitive edge. However, it is important to remember that technical indicators are not infallible and should be used in combination with other forms of analysis. Continual learning and practice are essential to master the art of utilizing technical indicators effectively in stock trading.
Top 5 Technical Indicators All Beginner Traders Should Use (Getting Started With Charts)
Frequently Asked Questions
Frequently Asked Questions (FAQs)
What are technical indicators in stock trading?
Technical indicators are mathematical calculations or graphical representations used to analyze stock price and volume data. They help traders understand and interpret market trends, forecast future price movements, and make informed trading decisions.
How do technical indicators work?
Technical indicators work by applying various formulas and algorithms to historical price and volume data. These calculations generate visual representations, such as lines or histograms, which help traders identify patterns, trends, and potential buying or selling opportunities in the stock market.
What are some commonly used technical indicators?
Some commonly used technical indicators in stock trading include moving averages, relative strength index (RSI), stochastic oscillator, MACD (Moving Average Convergence Divergence), Bollinger Bands, and Fibonacci retracement levels.
What is the significance of moving averages?
Moving averages are widely used technical indicators that smooth out price data over a specific time period. They help identify trends and potential support and resistance levels. Traders use moving averages to confirm market trends, determine entry and exit points, and generate trading signals.
How does the relative strength index (RSI) help traders?
The relative strength index (RSI) is a momentum oscillator that measures the speed and change of price movements. It helps traders identify overbought or oversold conditions in a stock, indicating potential trend reversals. The RSI is commonly used to generate buy or sell signals and confirm the strength of a trend.
What is the stochastic oscillator and how is it used in stock trading?
The stochastic oscillator is a momentum indicator that compares a stock’s closing price to its price range over a specific time period. It helps traders identify overbought or oversold conditions and potential trend reversals. The stochastic oscillator is often used to generate buy or sell signals and to confirm the direction of a trend.
What does MACD indicate in stock trading?
The Moving Average Convergence Divergence (MACD) is a trend-following momentum indicator that shows the relationship between two moving averages of a stock’s price. Traders use it to identify bullish or bearish crossovers, generate buy or sell signals, and confirm the strength of a trend. The MACD histogram also helps visualize the momentum of price movements.
How do Bollinger Bands assist traders in stock trading?
Bollinger Bands are volatility indicators that consist of a moving average (middle band) and two standard deviation bands (upper and lower bands). They help traders identify periods of high or low volatility, potential trend reversals, and price breakouts. Bollinger Bands are often used to set stop-loss orders and generate buy or sell signals.
What are Fibonacci retracement levels and how are they used?
Fibonacci retracement levels are horizontal lines used to identify potential support and resistance levels based on Fibonacci ratios. They help traders determine entry and exit points, and also provide insights into price corrections within an existing trend. Fibonacci retracement levels are drawn between significant high and low points on a stock chart.
Final Thoughts
Understanding technical indicators in stock trading is essential for successful investment decisions. These indicators, such as moving averages, volume, and relative strength index, provide valuable insights into the market trends and price movements. By analyzing these indicators, traders can identify potential entry and exit points, as well as determine the strength of a stock’s momentum. Whether you are a beginner or an experienced trader, grasping the concepts behind these indicators can greatly enhance your trading skills. Remember, a thorough understanding of technical indicators in stock trading is the key to making informed and profitable decisions.


