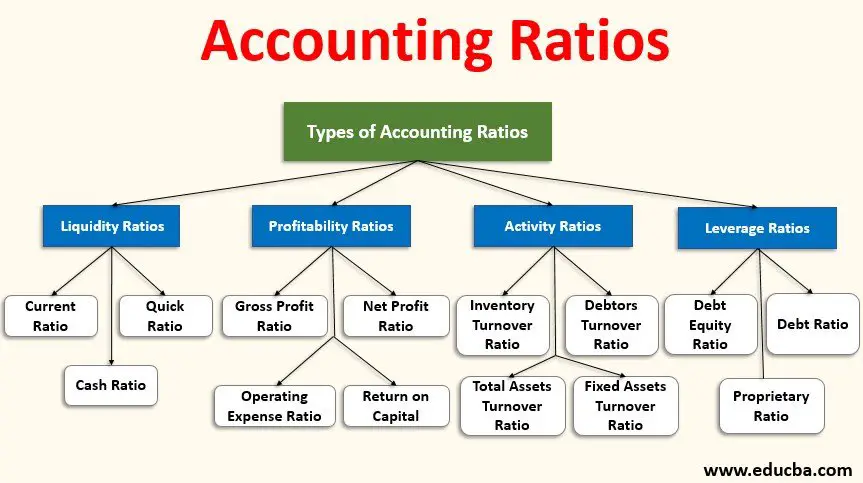
Understanding balance sheet ratios for investors is crucial for making informed investment decisions. If you’re wondering how to decipher these ratios and use them to your advantage, you’ve come to the right place. In this blog article, we will guide you through the world of balance sheet ratios, unravel their significance, and provide you with practical insights on how to analyze and interpret them effectively. By the end, you’ll have a solid grasp of understanding balance sheet ratios for investors, empowering you to make sound financial choices. So, let’s dive right in!
UNDERSTANDING BALANCE SHEET RATIOS FOR INVESTORS
As an investor, understanding financial statements is crucial to making informed decisions about which companies to invest in. One of the key financial statements that investors often analyze is the balance sheet. The balance sheet provides a snapshot of a company’s financial health at a specific point in time and helps investors assess its ability to meet short-term and long-term obligations.
To gain deeper insights from a balance sheet, investors often rely on various financial ratios derived from the balance sheet data. These ratios can provide valuable information about a company’s liquidity, solvency, profitability, and efficiency. In this article, we’ll explore some of the key balance sheet ratios that investors use to evaluate potential investment opportunities.
1. Liquidity Ratios
1.1 Current Ratio
The current ratio is a measure of a company’s short-term liquidity. It compares the company’s current assets to its current liabilities. Calculating the current ratio is as simple as dividing the total current assets by the total current liabilities. A higher current ratio indicates that a company has a greater ability to cover its short-term obligations.
1.2 Quick Ratio
Similar to the current ratio, the quick ratio measures a company’s ability to meet short-term obligations. However, the quick ratio excludes inventory from current assets as it may not be easily converted into cash. It is calculated by dividing the sum of cash, marketable securities, and accounts receivable by current liabilities. A higher quick ratio indicates better short-term liquidity.
1.3 Cash Ratio
The cash ratio is the most conservative liquidity ratio. It measures a company’s ability to meet short-term obligations using only its most liquid assets, such as cash and cash equivalents. It is determined by dividing cash and cash equivalents by current liabilities. A higher cash ratio indicates a stronger ability to cover short-term obligations.
2. Solvency Ratios
2.1 Debt-to-Equity Ratio
The debt-to-equity ratio quantifies the proportion of a company’s capital structure financed by debt and equity. It is calculated by dividing total debt by shareholders’ equity. A higher debt-to-equity ratio indicates a greater reliance on debt financing, which may increase the company’s financial risk.
2.2 Debt Ratio
The debt ratio measures the percentage of a company’s assets financed by debt. It is calculated by dividing total debt by total assets. A higher debt ratio indicates a higher degree of leverage and potential financial risk.
2.3 Interest Coverage Ratio
The interest coverage ratio assesses a company’s ability to meet interest obligations on its outstanding debt. It compares a company’s operating income to its interest expense. A higher interest coverage ratio indicates a greater ability to cover interest payments and suggests lower financial risk.
3. Profitability Ratios
3.1 Gross Profit Margin
The gross profit margin is a measure of a company’s profitability. It calculates the percentage of revenue that remains after deducting the cost of goods sold. A higher gross profit margin indicates better cost management and potential pricing power.
3.2 Net Profit Margin
The net profit margin measures how much profit a company generates from each dollar of revenue. It is calculated by dividing net income by total revenue. A higher net profit margin indicates efficient cost management and strong profitability.
3.3 Return on Assets (ROA)
Return on assets evaluates a company’s profitability in relation to its total assets. It measures how effectively a company utilizes its assets to generate profit. ROA is calculated by dividing net income by average total assets. A higher ROA indicates better asset utilization and profitability.
4. Efficiency Ratios
4.1 Inventory Turnover Ratio
The inventory turnover ratio measures how efficiently a company manages its inventory. It is calculated by dividing the cost of goods sold by the average inventory value. A higher inventory turnover ratio suggests effective inventory management and efficient utilization of resources.
4.2 Accounts Receivable Turnover Ratio
The accounts receivable turnover ratio assesses how quickly a company collects payment from its customers. It is calculated by dividing net credit sales by the average accounts receivable. A higher turnover ratio indicates efficient credit management and effective collection practices.
4.3 Asset Turnover Ratio
The asset turnover ratio measures a company’s efficiency in generating sales revenue from its assets. It is calculated by dividing total revenue by average total assets. A higher asset turnover ratio suggests effective utilization of assets to generate revenue.
By analyzing these balance sheet ratios, investors can gain a deeper understanding of a company’s financial position, stability, profitability, and efficiency. It is important to consider these ratios in conjunction with other factors, such as industry benchmarks and qualitative analysis, to make well-informed investment decisions. Remember, no single ratio can provide a complete assessment, and it’s essential to consider the bigger financial picture.
Remember, understanding balance sheet ratios is just one aspect of investment analysis. It is crucial to conduct comprehensive research and analysis, considering other financial statements, industry trends, and future growth prospects before making any investment decisions.
FINANCIAL RATIOS: How to Analyze Financial Statements
Frequently Asked Questions
Frequently Asked Questions (FAQs)
What are balance sheet ratios?
Balance sheet ratios are financial metrics used by investors to assess a company’s financial health and performance. These ratios analyze the relationship between different items on a company’s balance sheet, such as assets, liabilities, and equity, providing valuable insights into its liquidity, solvency, and profitability.
Why are balance sheet ratios important for investors?
Balance sheet ratios play a crucial role in investment analysis because they help investors gauge the financial strength and stability of a company. By examining ratios, investors can make informed decisions about potential investment opportunities, assess risk levels, and evaluate a company’s ability to generate profits, manage debt, and meet financial obligations.
What are some common balance sheet ratios used by investors?
Some common balance sheet ratios used by investors include the current ratio, debt-to-equity ratio, return on equity (ROE), return on assets (ROA), and the quick ratio. These ratios provide insights into a company’s liquidity, leverage, profitability, and overall financial performance.
How is the current ratio calculated?
The current ratio is calculated by dividing a company’s current assets by its current liabilities. It helps investors determine a company’s short-term liquidity and ability to meet its current obligations. A higher current ratio indicates a stronger ability to pay off short-term liabilities.
What does the debt-to-equity ratio indicate?
The debt-to-equity ratio compares a company’s total debt to its shareholders’ equity, showing the proportion of financing provided by creditors and shareholders. It indicates the company’s level of financial leverage and risk. A higher ratio suggests higher financial risk, as it means the company relies more on borrowed funds.
How is the return on equity (ROE) calculated?
The return on equity (ROE) is calculated by dividing a company’s net income by its shareholders’ equity. ROE measures a company’s profitability by assessing how effectively it generates profits from its shareholders’ investments. A higher ROE indicates better profitability and management efficiency.
What does the return on assets (ROA) ratio measure?
The return on assets (ROA) ratio measures a company’s profitability in relation to its total assets. It is calculated by dividing net income by total assets. ROA indicates how efficiently a company utilizes its assets to generate profits. A higher ROA suggests better asset utilization and profitability.
How is the quick ratio different from the current ratio?
The quick ratio, also known as the acid-test ratio, is similar to the current ratio but excludes inventory from current assets. It provides a more conservative measure of a company’s short-term liquidity, as inventory may not be easily converted into cash. The quick ratio helps assess a company’s ability to pay off short-term obligations without relying on inventory sales.
What other balance sheet ratios should investors consider?
In addition to the commonly used ratios, investors may consider other balance sheet ratios such as the asset turnover ratio, debt ratio, interest coverage ratio, and gross margin ratio. These ratios provide additional insights into a company’s efficiency, capital structure, ability to cover interest expenses, and profitability.
Final Thoughts
Understanding balance sheet ratios is essential for investors. These ratios provide valuable insights into a company’s financial health and performance. By analyzing ratios such as liquidity, solvency, and profitability, investors can make well-informed decisions regarding their investment portfolio. These ratios help investors assess a company’s ability to meet short-term obligations, its overall financial stability, and its profitability potential. With a clear understanding of these ratios, investors can identify potential risks and opportunities, mitigating the chances of making poor investment choices. To become a successful investor, mastering the art of understanding balance sheet ratios is a must.


